These Ingersoll Rand statistics summarize recent financial performance, cash generation, and market value using the company’s latest reported results and widely used market data sources.
Ingersoll Rand statistics snapshot
| Metric | Value | Period / Date |
|---|---|---|
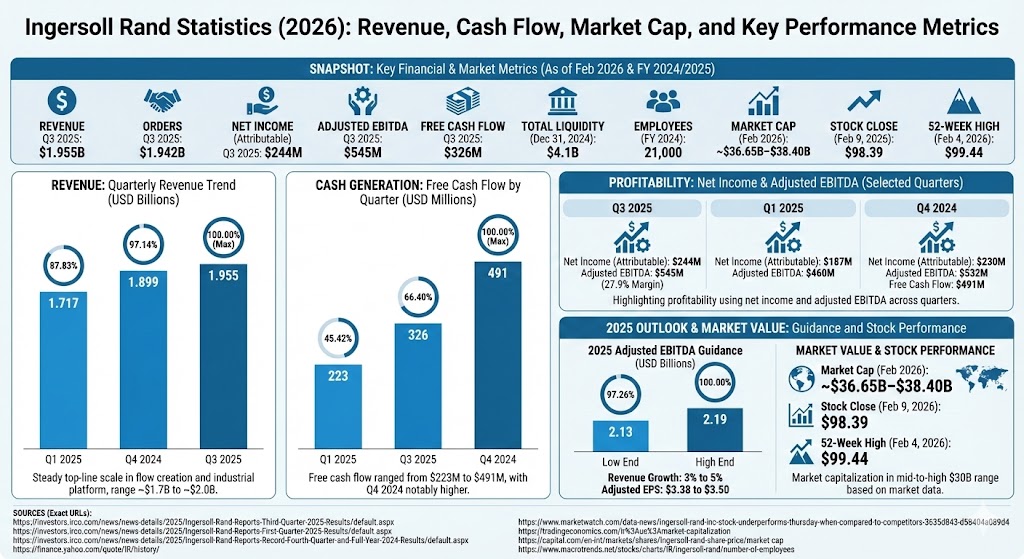
| Revenue | $1.955B | Q3 2025 |
| Orders | $1.942B | Q3 2025 |
| Net income (attributable) | $244M | Q3 2025 |
| Adjusted EBITDA | $545M | Q3 2025 |
| Free cash flow | $326M | Q3 2025 |
| Revenue | $1.899B | Q4 2024 |
| Free cash flow | $491M | Q4 2024 |
| Total liquidity | $4.1B | As of Dec 31, 2024 |
| Employees | 21,000 | FY 2024 |
| Market capitalization | ~$36.65B–$38.40B | February 2026 (reported by market data providers) |
| Stock close | $98.39 | Feb 9, 2026 |
| 52-week high (reported) | $99.44 | Feb 4, 2026 |
Ingersoll Rand revenue statistics
Recent quarterly results show Ingersoll Rand revenues in the ~$1.7B to ~$2.0B range across the reported quarters below, supporting a view of steady top-line scale in its flow creation and industrial platform.
Ingersoll Rand statistics chart: Quarterly revenue (USD billions)
| Quarter | Revenue (USD B) | Bar | Bar width (computed) | |
|---|---|---|---|---|
| Q1 2025 | 1.717 |
| 87.83% (1.717 / 1.955) | |
| Q4 2024 | 1.899 |
| 97.14% (1.899 / 1.955) | |
| Q3 2025 | 1.955 |
| 100.00% (1.955 / 1.955) |
Computed bar widths (value/max):
Q1 2025: 1.717/1.955 = 87.83%
Q4 2024: 1.899/1.955 = 97.14%
Q3 2025: 1.955/1.955 = 100.00%
Cash generation and free cash flow statistics
Cash conversion is a key part of many Ingersoll Rand statistics analyses. In the quarters cited below, free cash flow ranged from $223M to $491M, with Q4 2024 notably higher.
Ingersoll Rand statistics chart: Free cash flow by quarter (USD millions)
| Quarter | Free Cash Flow (USD M) | Bar | Bar width (computed) | |
|---|---|---|---|---|
| Q1 2025 | 223 |
| 45.42% (223 / 491) | |
| Q3 2025 | 326 |
| 66.40% (326 / 491) | |
| Q4 2024 | 491 |
| 100.00% (491 / 491) |
Computed bar widths (value/max):
Q1 2025: 223/491 = 45.42%
Q3 2025: 326/491 = 66.40%
Q4 2024: 491/491 = 100.00%
Profitability statistics: net income and adjusted EBITDA
Ingersoll Rand statistics often highlight profitability using net income and adjusted EBITDA. In Q3 2025 the company reported net income attributable to Ingersoll Rand of $244M and adjusted EBITDA of $545M (27.9% margin as reported in the earnings release). In Q1 2025, net income attributable was $187M and adjusted EBITDA was $460M.
- Q3 2025: Net income $244M; adjusted EBITDA $545M; revenue $1.955B; orders $1.942B.
- Q1 2025: Net income $187M; adjusted EBITDA $460M; revenue $1.717B; orders $1.882B.
- Q4 2024: Net income $230M; adjusted EBITDA $532M; revenue $1.899B; free cash flow $491M.
2025 outlook statistics (company guidance)
For forward-looking Ingersoll Rand statistics, the company’s full-year 2025 guidance (provided with its Q4/full-year 2024 release) included revenue growth of 3% to 5%, adjusted EBITDA of $2.13B to $2.19B, and adjusted EPS of $3.38 to $3.50.
Ingersoll Rand statistics chart: 2025 adjusted EBITDA guidance (USD billions)
| Guidance point | Adjusted EBITDA (USD B) | Bar | Bar width (computed) | |
|---|---|---|---|---|
| Low end | 2.13 |
| 97.26% (2.13 / 2.19) | |
| High end | 2.19 |
| 100.00% (2.19 / 2.19) |
Computed bar widths (value/max):
Low end: 2.13/2.19 = 97.26%
High end: 2.19/2.19 = 100.00%
Market value statistics: market cap and recent trading levels
Market-value-focused Ingersoll Rand statistics in early February 2026 placed the company’s market capitalization in the mid-to-high $30B range based on widely cited market data providers. Recent price history also showed a closing price of $98.39 on Feb 9, 2026, and market coverage cited a 52-week high of $99.44 on Feb 4, 2026.
- Market cap (February 2026): approximately $36.65B to $38.40B (varies by source/date methodology).
- Stock close (Feb 9, 2026): $98.39.
- 52-week high cited (Feb 4, 2026): $99.44.
Workforce statistics
Employee count is another commonly referenced Ingersoll Rand statistics line item. A frequently cited figure for FY 2024 is about 21,000 employees.
Sources (Exact URLs)
- https://investors.irco.com/news/news-details/2025/Ingersoll-Rand-Reports-Third-Quarter-2025-Results/default.aspx
- https://investors.irco.com/news/news-details/2025/Ingersoll-Rand-Reports-First-Quarter-2025-Results/default.aspx
- https://investors.irco.com/news/news-details/2025/Ingersoll-Rand-Reports-Record-Fourth-Quarter-and-Full-Year-2024-Results/default.aspx
- https://finance.yahoo.com/quote/IR/history/
- https://www.marketwatch.com/data-news/ingersoll-rand-inc-stock-underperforms-thursday-when-compared-to-competitors-3635d843-d58404a089d4
- https://tradingeconomics.com/ir%3Aus%3Amarket-capitalization
- https://capital.com/en-int/markets/shares/ingersoll-rand-share-price/market-cap
- https://www.macrotrends.net/stocks/charts/IR/ingersoll-rand/number-of-employees